Grafana in docker setup
Sep 6, 2018 11:54 · 1699 words · 8 minute read
Grafana
Grafana is a tool that lets you visualize metrics. It handles a lot of different data sources and is very flexible. It does not require you to be an it expert to setup and with just few easy steps you can connect to your database or service and present live metric that can help you more deeply understand how your system is used. With a system of alerts it tell you about bottlenecks that you might not know of, like moments in time when your system is overloaded and you database is dying.
And it is all free and open sourced 😍.
What for
Today most multi-services platforms are build using docker containers. It provides you with great flexibility and this is what I wanted to have with grafana just a standalone docker image that I can have pre-configured and ready to deploy in dcos for example.
What I wanted to achieve with grafana is to have a nice display of what is happening in production database. I wanted to create dashboard that will query some data and will present valuable information that I can easily interpret.
So what I am going to explain here is a grafana connection to mysql database. But as I can imagine other data sources might by as “simple” as this one. After fighting all issues that I encountered, everything else should be easy.
Initial setup
So lets begin by making sure that you have docker installed. I used the latest version that is available here. I will be using terminal commands a lot so just be sure to keep terminal window opened.
After that we need to have grafana docker image installed. It is easily available from docker hub (it is where all official docker images are available). To download grafana image just type in:
docker pull grafana/grafana
This will download grafana image, to run it and make sure that everything is working correctly just type in terminal:
docker run -d grafana/grafana
The -d option here is to run image as a demon. Grafna is configured to run on port 3000, it is a popular port so before running make sure it is not taken already on your machine.
Docker will tell you that port is taken by displaying error message with something like:
failed: port is already allocated
If you already have something running there then it is easy to change port for docker container, just change above command like this:
docker run -d -p 3001:3000 grafana/grafana
it will start on 3001 port, I think you get the idea how it works, 3001 is a external port and 3000 is a docker inside port that will be mapped to external.
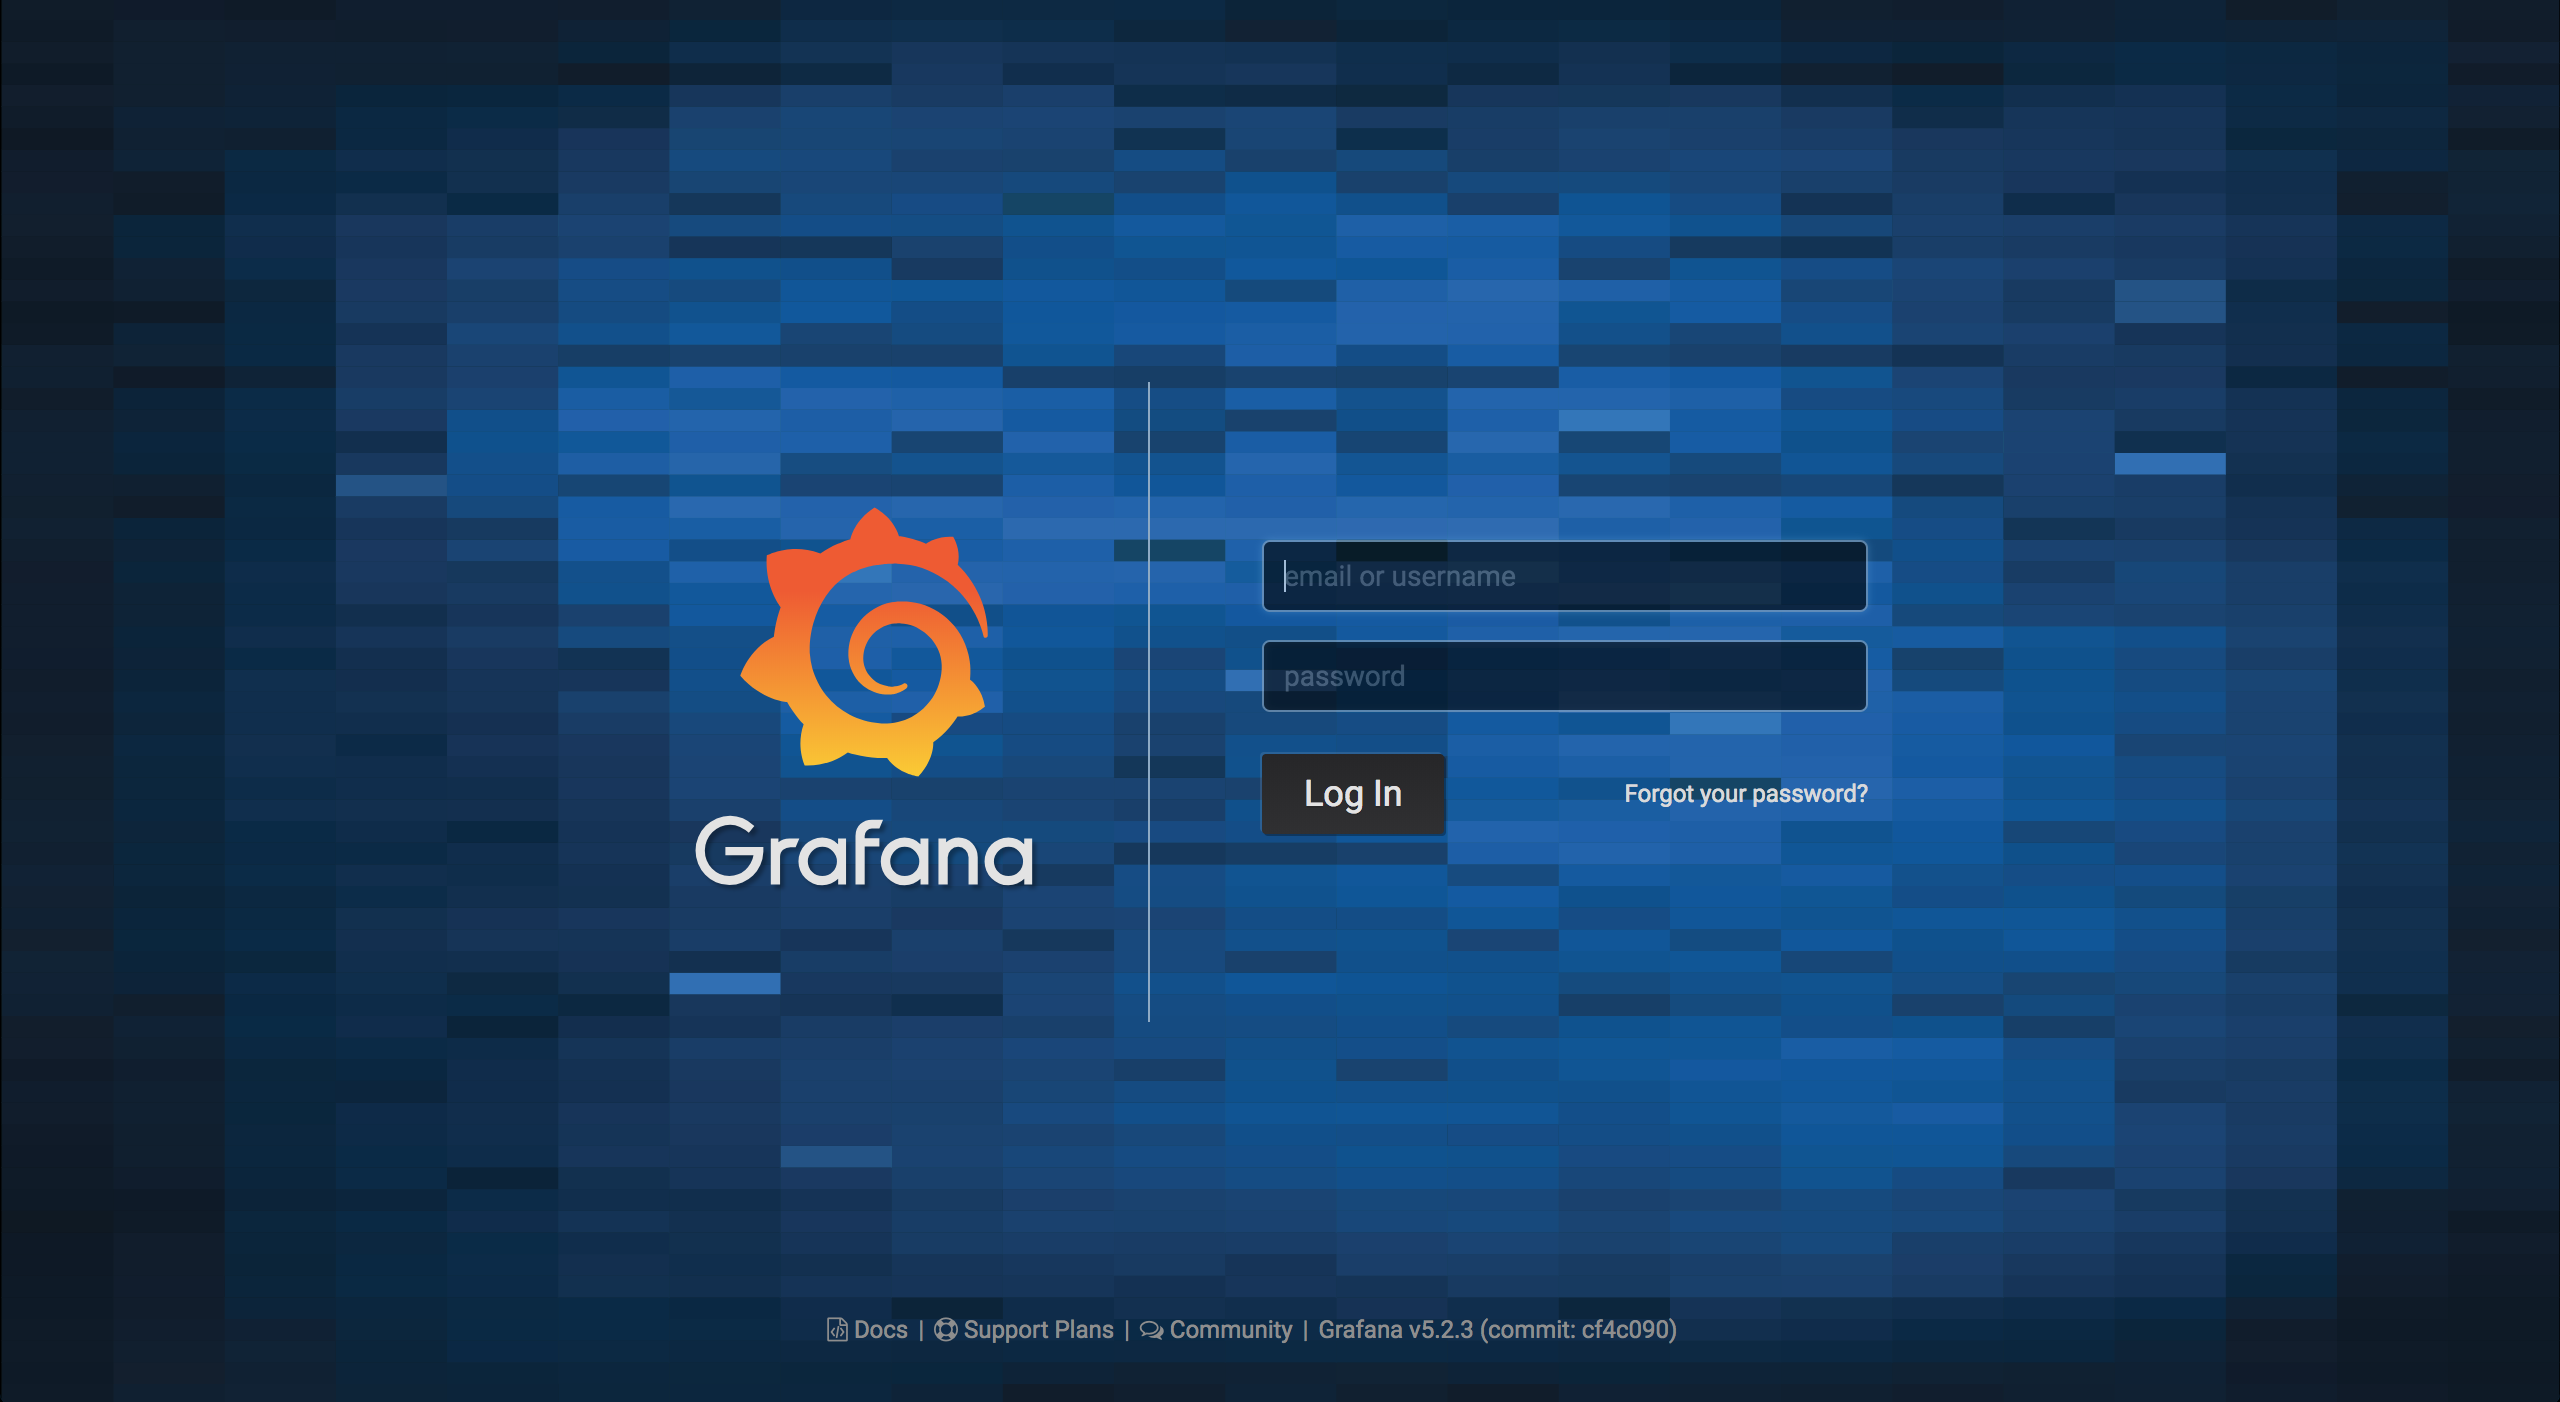
Now that everything is running you just need to check if it is working just by going to:
localhost:3000
It should display something like this:
Configuring docker image
Well as you probably already know, there are multiple options to change container behavior. What I did is prepared my own grafana docker image. This way I am able to configure everything I want, build image and run it.
Creating grafana docker image
First we need to create Dockerfile yes, there is no extension there.
I will not describe what parameters you can add into dockerfile cause there are so many, I will just describe the one I used.
So here is all that you need to have in your configuration to be able to build accessible grafana image:
FROM grafana/grafana

ENV GF_AUTH_DISABLE_LOGIN_FORM "true"
ENV GF_AUTH_ANONYMOUS_ENABLED "true"
ENV GF_AUTH_ANONYMOUS_ORG_ROLE "Admin"
If you have it already then the only thing to do is call docker build in terminal like this:
docker build -t my-grafana .
And that is it, it will build fully workable docker container with grafana inside.
Let me now describe what is going on in this file.
FROM keyword describes what source image will be used to build this one, in our case it will be default grafana/grafana image.
Next is ENV keyword that is responsible for adding new env variables to the container, so when it starts it already has these variables set.
Grafana configuration
So why I am using exactly these variables. Grafana by default is configured with grafana.ini file that is located in /etc/grafana/grafana.ini or /usr/local/etc/grafana/grafana.ini. This file contains a lot of configuration possibilities but there is no way to modify them inside container because when we run container it is to late to go and modify the file, server is already up and ini file is already loaded.
But to overcome this limitation, grafana introduced env variables convention. It basically matches initial configurations with corresponding environment variable.
To create correct variable we need to know what name it has in grafana.ini file.
So here are some examples of variable names and their matches from file:
    GF_AUTH_DISABLE_LOGIN_FORM "true"
    /* is equivalent to */
    [auth]
    disable_login_form = true
    ...
    GF_AUTH_ANONYMOUS_ENABLED "true"
    /* is equivalent to */
    [auth.anonymous]
    enabled = true
I think you can get the idea. Every variable must start with GF_ and then goes section title plus underscore, if section title contain dot then we can replace dot with underscore, at the end upper cased configuration name and value.
Content configuration
So for my case I wanted to already have some content inside my server, like default data source or some initial dashboard. This way I can always put these files in repository and track changes.
So how can we do than. Well fortunately grafana supports that kind of stuff as well out of the box, amazing 💯.
Adding data source
To add new data source we need to create configuration file called datasources.yaml inside container under /etc/grafana/provisioning/datasources.
Again the problem is that it is inside container and after container is running it is to late. So what we can do is mount a volume under that path.
So first we need to create folder provisioning and inside folder named datasources and then inside this folder create file datasources.yaml that will contain our default data source configuration.
But what kind of configuration we can put there. Well besides looking into grafana documentation you can go into container and look into sample configuration file. First display all running containers with command
docker ps
it should aoutput something like this:
CONTAINER ID        IMAGE               COMMAND             CREATED             STATUS              PORTS                    NAMES
8ecddfc1ade3        my-grafana          "/run.sh"           About an hour ago   Up About an hour    0.0.0.0:3000->3000/tcp   elastic_brown
What’s important is container id so copy that and execute next command
docker exec -it CONTAINER ID bash
This command will take you inside the running container. Here you have a bare linux image. So to display sample data source file configuration just run
cat ./usr/share/grafana/conf/provisioning/datasources/sample.yaml
This should display a sample, something like this:
# # config file version
apiVersion: 1

# # list of datasources that should be deleted from the database
#deleteDatasources:
#   - name: Graphite
#     orgId: 1

# # list of datasources to insert/update depending
# # on what's available in the database
#datasources:
#   # <string, required> name of the datasource. Required
# - name: Graphite
#   # <string, required> datasource type. Required
#   type: graphite
#   # <string, required> access mode. direct or proxy. Required
#   access: proxy
...
As you can see, there are a lot options to play with, but for now what is important for us is section where datasources are described.
Remember that yaml format is very sensitive to any kind of whitespace signs, tabulators
First configuration should look something like this:
 0datasources:
 1    - name: test
 2      type: mysql
 3      orgId: 1
 4      url: mysql.host.address.com
 5      password: grafana
 6      user: grafana
 7      database: test
 8      editable: true
 9      isDefault: true
That is all you need to tell grafana about your mysql connection, here I am setting it as a editable, but I am not sure if it is actually already implemented feature. Remember to change these settings to the once that match your configuration, I just typed here some dummy stuff. Also covering password would be nice.
Save this file inside created directory structure.
Now to mount this as a volume we need to execute docker run with additional -v parameter. Cd to root path where provisioning dir is.
Remember that we want to replace path inside container /etc/grafana/provisioning/datasources with ./provisioning to do so, mount that dir just by calling:
docker run -p 3000:3000 -d -v $(pwd)/provisioning:/etc/grafana/provisioning my-grafana
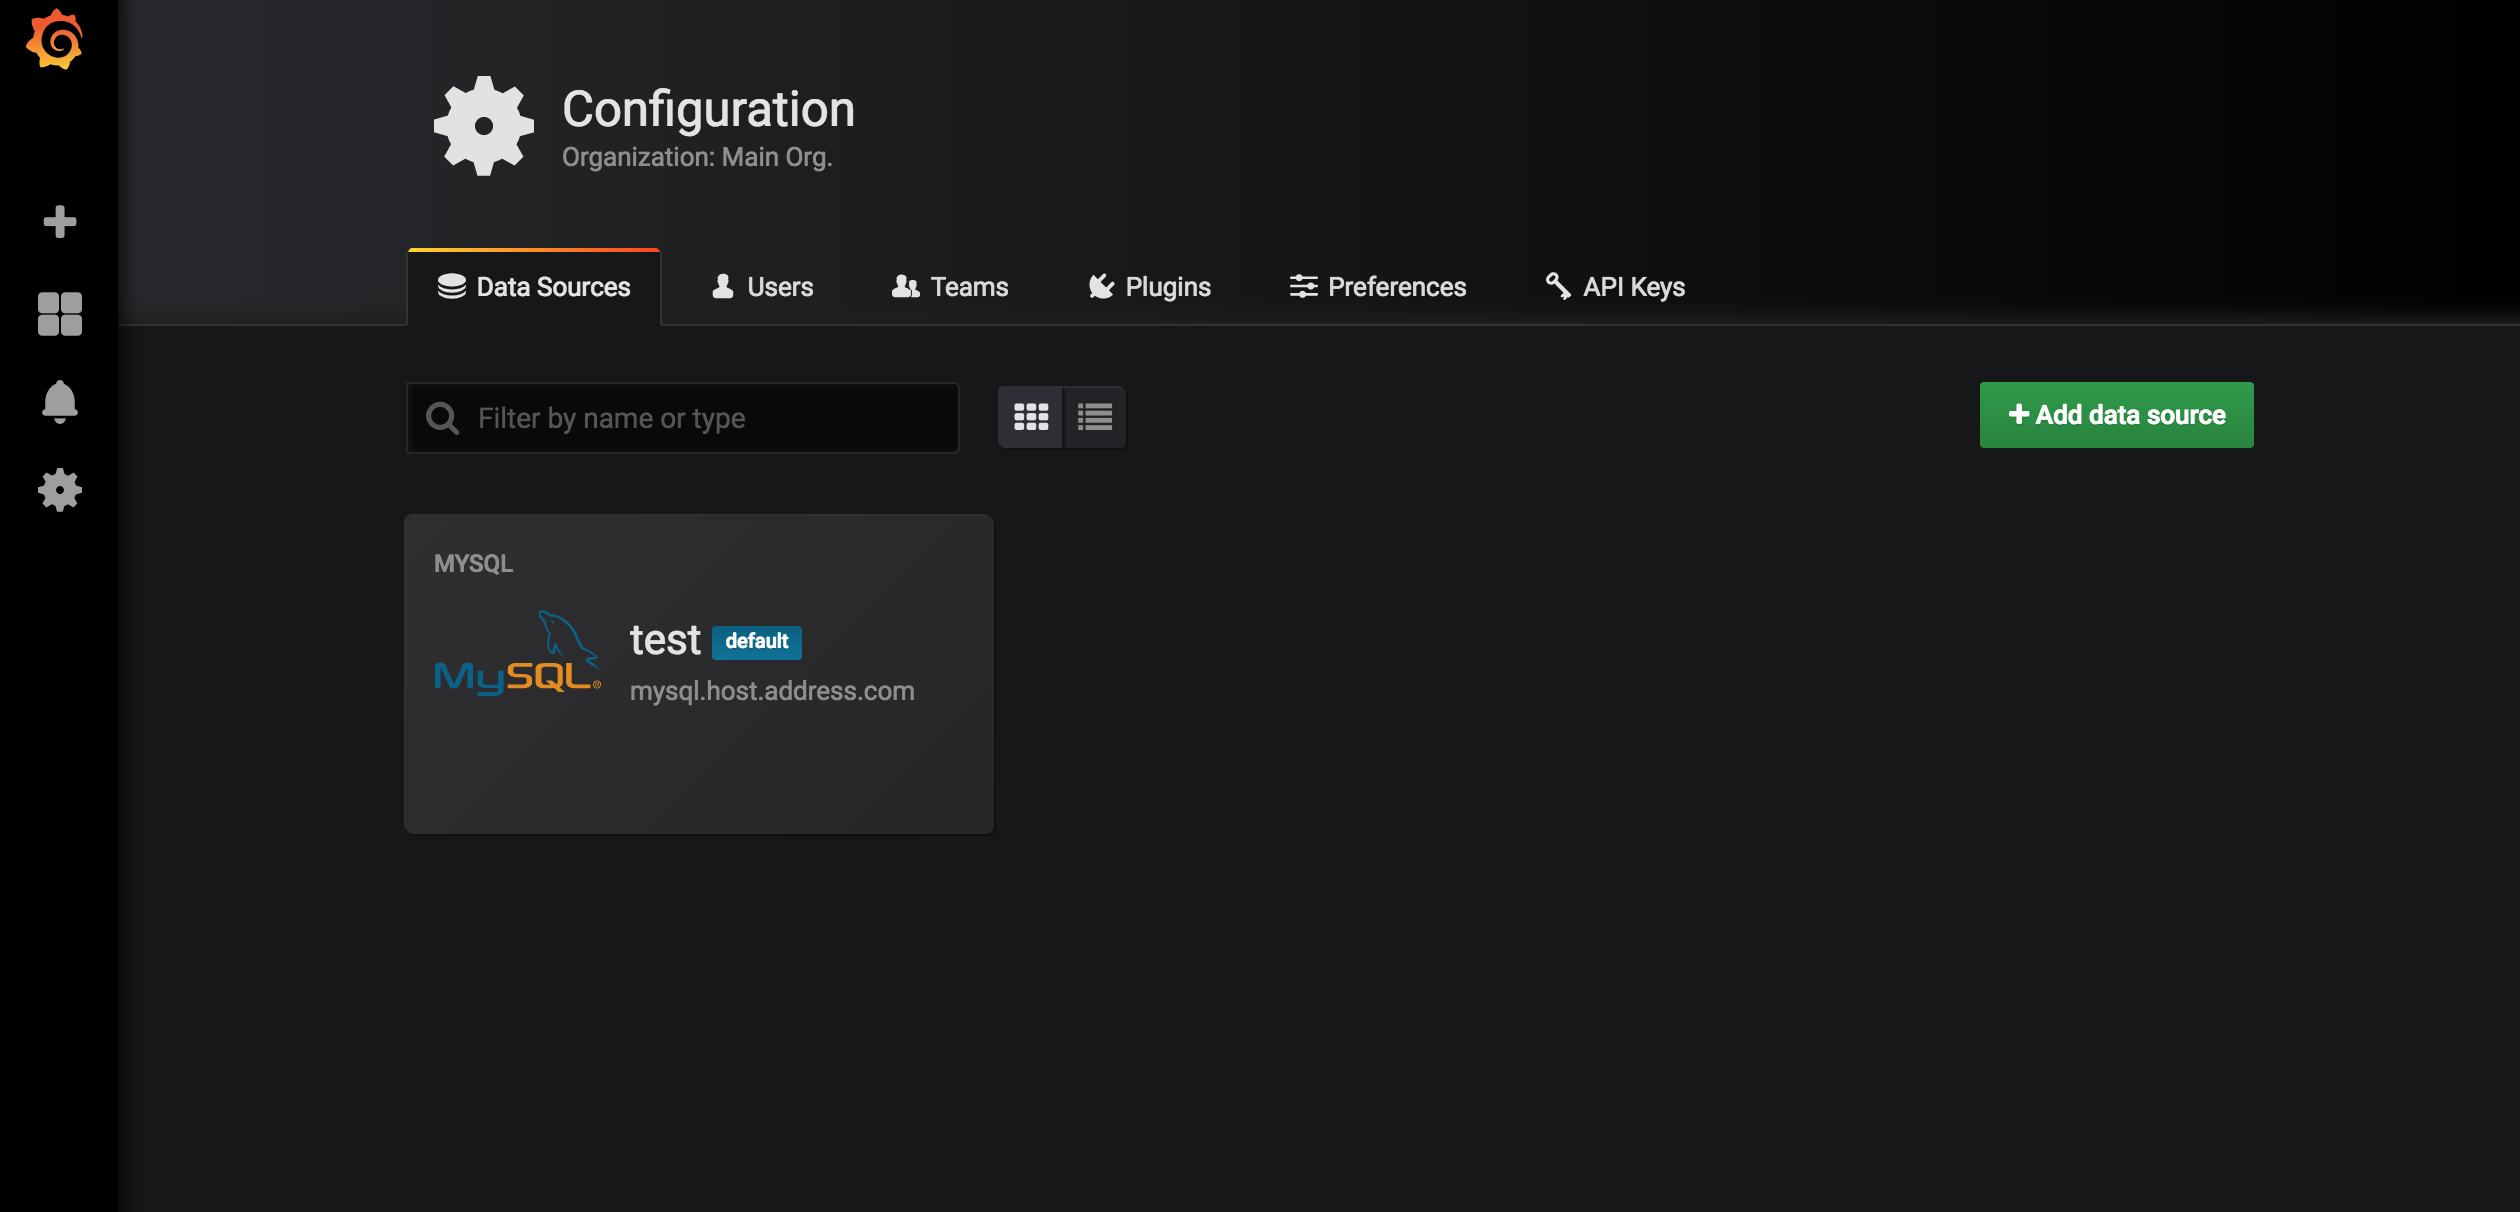
Now if you go to localhost:3000 under Configuration -> Data Source you can see that our test configuration is added.
Adding dashboard
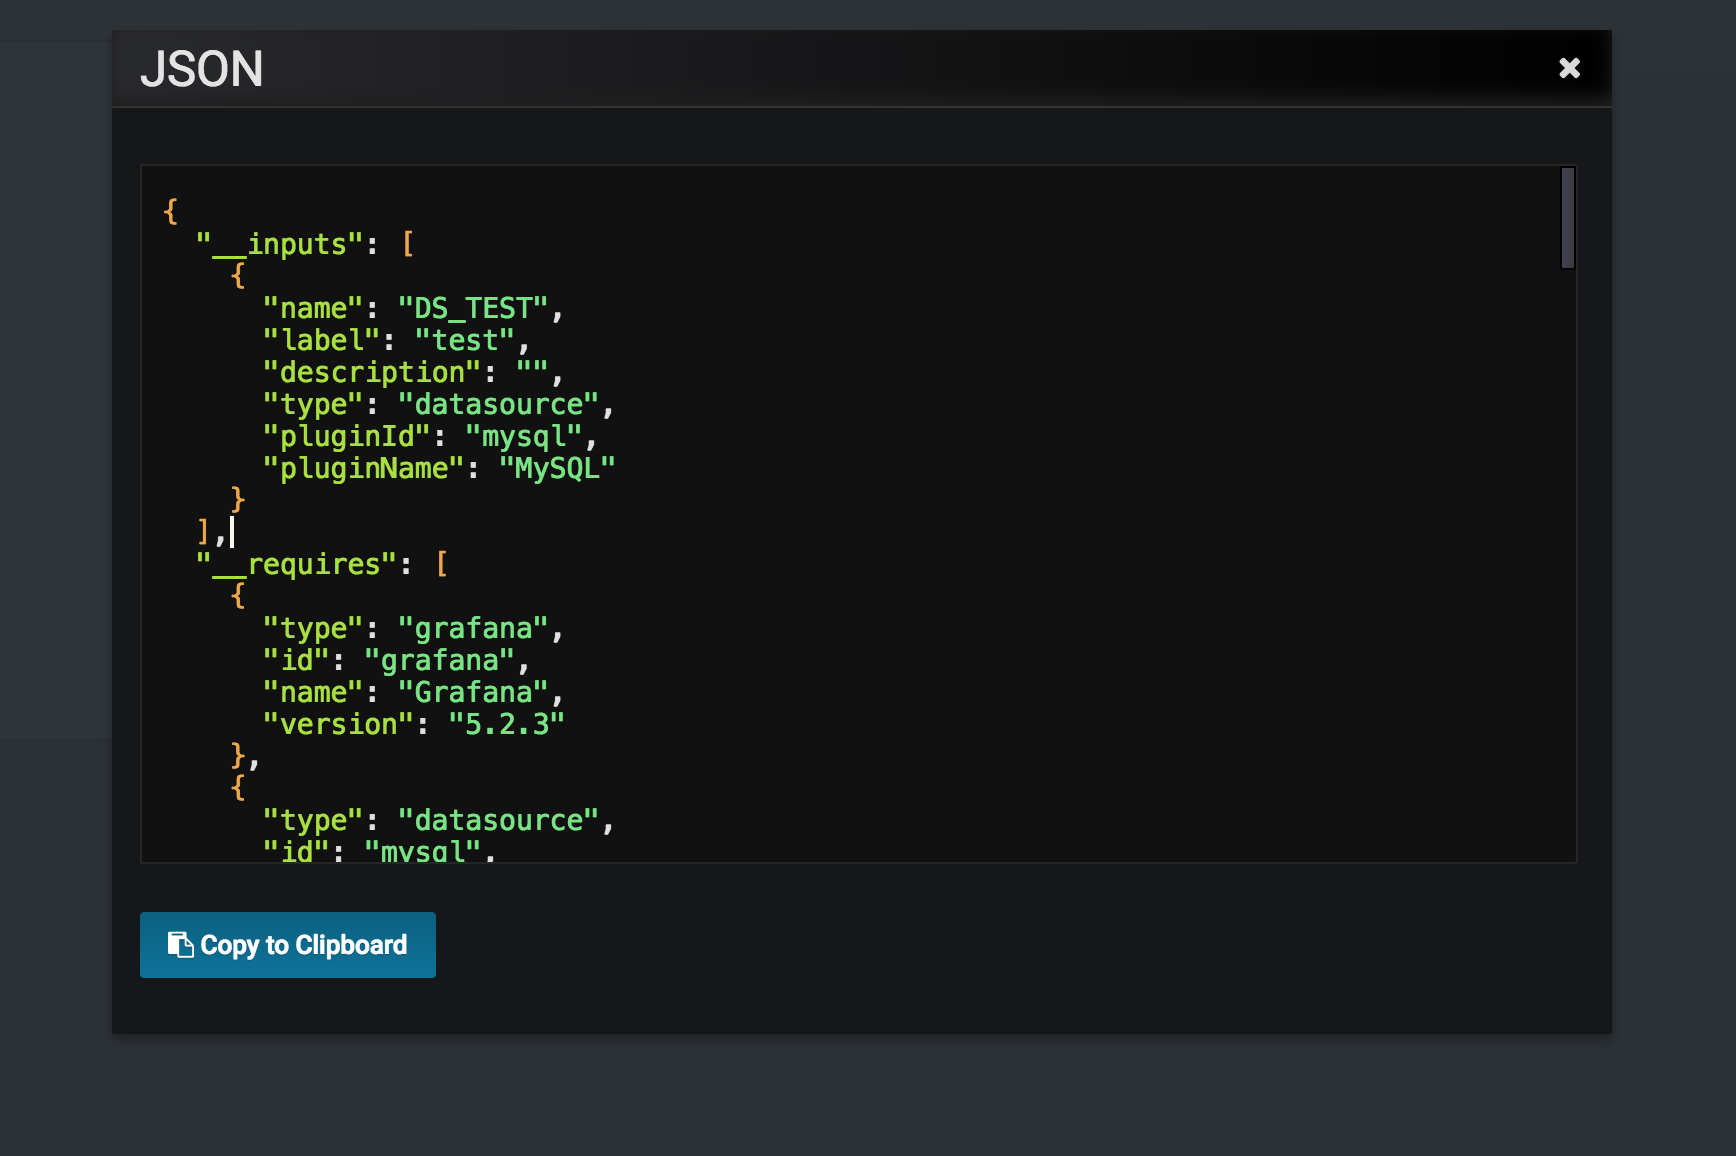
So this is going to be really simple. To create first dashboard, just go to grafana and create one. You already have grafana connected to your datasoure and all should already work just fine. After creating dashboard you need to export it as a json file like here:
Now remember the folder structure we created? The part with /provisioning/datasources ? To add ready dashboard you just need to create new directory on the same level that datasources is, called dashboards. There you just need to add exported json in file with *.json extension. Name does not matter, grafana will load all json dashboards form that file path.
Scripting
That was all the needed configuration. What is left is making things…more swifty and to do that let us put all that stuff into scripts to be able to use it easily.
Create build.sh script that will look like that:
0#!/bin/bash
1docker build -t my-grafana .
And run.sh script for running your image:
0#!/bin/bash
1docker run -p 3000:3000 -d -v $(pwd)/provisioning:/etc/grafana/provisioning my-grafana
That is it, you now have working grafana container with pre-configured dashboard and datasource that is ready to deploy wherever you want to have it.
Summary
Grafana is a powerful analytical tool that can help you draw some conclusions about how your system works or just to monitor behavior of components that you have. Here We prepared a full configuration that can be kept in repository and easily deployed in dcos cluster for example. I had a lot of fun setting it up and analyzing data from services and databases, it is amazing tool that you should consider using. Have fun 😄 and if you want, you can checkout here is all we did in this note.